3、親和力傳播
親和力傳播包括找到一組最能概括數據的范例。
我們設計了一種名為“親和傳播”的方法,它作為兩對數據點之間相似度的輸入度量。在數據點之間交換實值消息,直到一組高質量的范例和相應的群集逐漸出現
—源自:《通過在數據點之間傳遞消息》2007。
它是通過 AffinityPropagation 類實現的,要調整的主要配置是將“ 阻尼 ”設置為0.5到1,甚至可能是“首選項”。
下面列出了完整的示例。
# 親和力傳播聚類
from numpy import unique
from numpy import where
from sklearn.datasets import make_classification
from sklearn.cluster import AffinityPropagation
from matplotlib import pyplot
# 定義數據集
X, _ = make_classification(n_samples=1000,
n_features=2,
n_informative=2,
n_redundant=0,
n_clusters_per_class=1,
random_state=4)
# 定義模型
model = AffinityPropagation(damping=0.9)
# 匹配模型
model.fit(X)
# 為每個示例分配一個集群
yhat = model.predict(X)
# 檢索唯一群集
clusters = unique(yhat)
# 為每個群集的樣本創建散點圖
for cluster in clusters:
# 獲取此群集的示例的行索引
row_ix = where(yhat == cluster)
# 創建這些樣本的散布
pyplot.scatter(X[row_ix, 0], X[row_ix, 1])
# 繪制散點圖
pyplot.show()
運行該示例符合訓練數據集上的模型,并預測數據集中每個示例的群集。然后創建一個散點圖,并由其指定的群集著色。在這種情況下,我無法取得良好的結果。
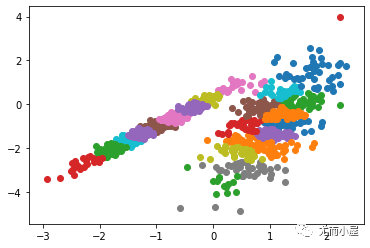
圖:數據集的散點圖,具有使用親和力傳播識別的聚類
4、聚合聚類
聚合聚類涉及合并示例,直到達到所需的群集數量為止。它是層次聚類方法的更廣泛類的一部分,通過 AgglomerationClustering 類實現的,主要配置是“ n _ clusters ”集,這是對數據中的群集數量的估計,例如2。下面列出了完整的示例。
# 聚合聚類
from numpy import unique
from numpy import where
from sklearn.datasets import make_classification
from sklearn.cluster import AgglomerativeClustering
from matplotlib import pyplot
# 定義數據集
X, _ = make_classification(n_samples=1000,
n_features=2,
n_informative=2,
n_redundant=0,
n_clusters_per_class=1,
random_state=4)
# 定義模型
model = AgglomerativeClustering(n_clusters=2)
# 模型擬合與聚類預測
yhat = model.fit_predict(X)
# 檢索唯一群集
clusters = unique(yhat)
# 為每個群集的樣本創建散點圖
for cluster in clusters:
# 獲取此群集的示例的行索引
row_ix = where(yhat == cluster)
# 創建這些樣本的散布
pyplot.scatter(X[row_ix, 0], X[row_ix, 1])
# 繪制散點圖
pyplot.show()
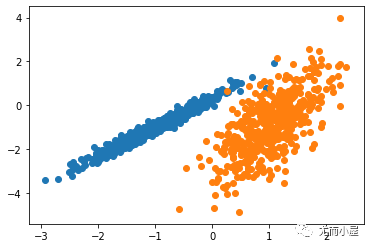
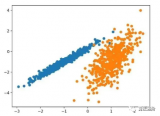
運行該示例符合訓練數據集上的模型,并預測數據集中每個示例的群集。然后創建一個散點圖,并由其指定的群集著色。在這種情況下,可以找到一個合理的分組。

圖:使用聚集聚類識別出具有聚類的數據集的散點圖
5、BIRCH
BIRCH 聚類( BIRCH 是平衡迭代減少的縮寫,聚類使用層次結構)包括構造一個樹狀結構,從中提取聚類質心。
BIRCH 遞增地和動態地群集傳入的多維度量數據點,以嘗試利用可用資源(即可用內存和時間約束)產生最佳質量的聚類。
—源自:《 BIRCH :1996年大型數據庫的高效數據聚類方法》
它是通過 Birch 類實現的,主要配置是“ threshold ”和“ n _ clusters ”超參數,后者提供了群集數量的估計。下面列出了完整的示例。
# birch聚類
from numpy import unique
from numpy import where
from sklearn.datasets import make_classification
from sklearn.cluster import Birch
from matplotlib import pyplot
# 定義數據集
X, _ = make_classification(n_samples=1000,
n_features=2,
n_informative=2,
n_redundant=0,
n_clusters_per_class=1,
random_state=4)
# 定義模型
model = Birch(threshold=0.01, n_clusters=2)
# 適配模型
model.fit(X)
# 為每個示例分配一個集群
yhat = model.predict(X)
# 檢索唯一群集
clusters = unique(yhat)
# 為每個群集的樣本創建散點圖
for cluster in clusters:
# 獲取此群集的示例的行索引
row_ix = where(yhat == cluster)
# 創建這些樣本的散布
pyplot.scatter(X[row_ix, 0], X[row_ix, 1])
# 繪制散點圖
pyplot.show()
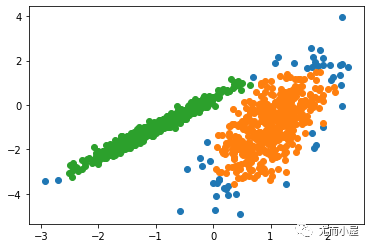
運行該示例符合訓練數據集上的模型,并預測數據集中每個示例的群集。然后創建一個散點圖,并由其指定的群集著色。在這種情況下,可以找到一個很好的分組。

圖:使用BIRCH聚類確定具有聚類的數據集的散點圖
-
代碼
+關注
關注
30文章
4868瀏覽量
69897 -
數據分析
+關注
關注
2文章
1467瀏覽量
34603 -
python
+關注
關注
56文章
4821瀏覽量
85647
發布評論請先 登錄
相關推薦
一種基于聚類和競爭克隆機制的多智能體免疫算法
基于MCL與Chameleon的混合聚類算法

Python無監督學習的幾種聚類算法包括K-Means聚類,分層聚類等詳細概述




評論