So far, we have published three tutorialson using our new NanoBeacon BLE Scanner mobile app. We covered the following topics:
到目前為止,我們已經發布了三個關于使用我們新的NanoBeacon BLE掃描器移動應用程序的教程。我們涵蓋了以下主題:
- Introduction to the NanoBeacon BLE Scanner mobile app
- NanoBeacon BLE掃描器移動應用程序介紹
- Installation and setup
- 安裝和設置
- Overview of the different features of the app
- 該應用程序的不同功能概述
- How to use the mobile app to discover your IN100 tags
- 如何使用移動應用程序來發現您的IN100標簽
- 設備過濾器的概述
- iOS應用程序和Android應用程序之間的差異
- 檢測觸發的廣播集的應用程序通知
In this tutorial, we will cover the “Logs” and “Monitor” features of the mobile app (available in the latest version of the app)
在本教程中,我們將介紹移動應用程序的 "日志 "和 "監控 "功能(在應用程序的最新版本中可用)。
Let’s get started!
讓我們開始吧!
Logging Feature 記錄功能
First, make sure you have the latest version of the app (whether that’s for iOS or Android).
首先,確保你有最新版本的應用程序(無論是iOS還是Android)。
Once you have the latest version installed, go ahead and launch the app.
一旦你安裝了最新版本,就去啟動該應用程序。
For a simple test case, we’ll be configuring the IN100 with the following parameters:
對于一個簡單的測試案例,我們將用以下參數配置IN100:
- One advertising set
- 一個廣播集
- Advertising Data
- 廣播數據
- Advertising data format: Custom
- 廣播數據格式:自定義
- Device Name: “IN100”
- 設備名稱:"IN100"
- Manufacturer Specific Data: VCC, Internal Temp
- 制造商特定數據:VCC,內部溫度
- Advertising Parameters
- 廣播參數
- Advertising Interval: 100 ms
- 廣播間隔:100毫秒
Once you have the parameters set as above, make sure you probe and connect to the device, then click “Run in RAM.”
一旦你設置了上述參數,確保你探測并連接到設備,然后點擊 "在RAM中運行"。
Finally, import your IN100 configuration from NanoBeacon Config Tool (via the QR code) into the mobile app.
最后,將你的IN100配置從NanoBeacon配置工具(通過QR碼)導入移動應用程序。
Now that we have the configuration imported into the mobile app, we should see the following in the “Configuration” view:
現在我們已經將配置導入移動應用程序,我們應該在 "配置 "視圖中看到以下內容:
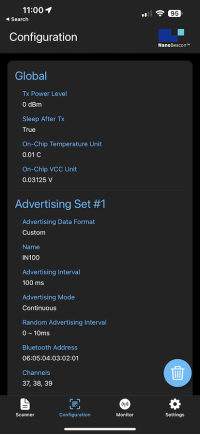
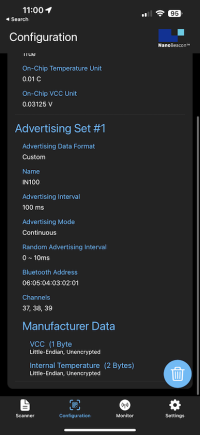
Verify that the configuration is correct, and then navigate to the “Scanner” view.
驗證配置是否正確,然后導航到 "掃描器 "視圖。
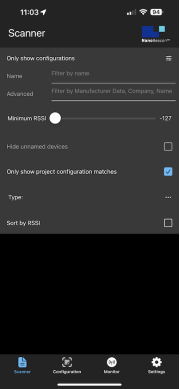
Once in the Scanner view, enable the filter “Only show project configuration matches”:
一旦進入 "掃描器 "視圖,啟用過濾器 "只顯示項目配置匹配":
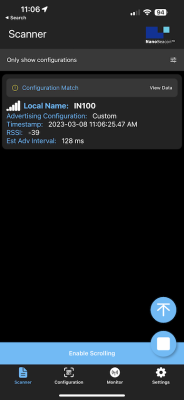
Now, exit the filter view and refresh the scan. You should see the following on screen:
現在,退出過濾器視圖并刷新掃描。你應該在屏幕上看到以下內容:
Now, click on the “View Data” text to see the detailed real-time advertising data:
現在,點擊 "查看數據 "文本,查看詳細的實時廣播數據:
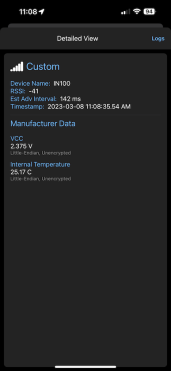
From here, notice the “Logs” button in the top right corner of the screen. Click on it, and now you should see a real-time log of the captured data. Basically, this shows the history of all the advertising data captured by the app. Once in this view, you’ll also notice that there’s an export button in the top right-hand corner of the screen:
在這里,注意屏幕右上角的 "日志 "按鈕。點擊它,現在你應該看到捕獲數據的實時日志。基本上,這顯示了該應用程序捕獲的所有廣播數據的歷史。一旦進入這個視圖,你還會注意到,在屏幕的右上角有一個導出按鈕:
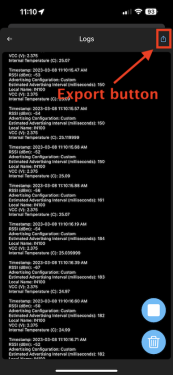
This allows you to export the full log via email, clipboard, and other methods supported by your device:
這允許你通過電子郵件、剪貼板和你的設備支持的其他方法導出完整的日志:
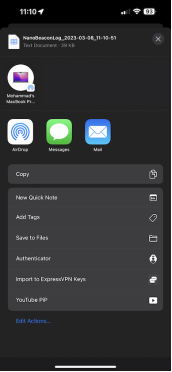
The exported format is in CSV (comma-separated values), so you can easily import it into Excel or any other spreadsheet app you choose.
導出的格式是CSV(omma-separated values),所以你可以很容易地把它導入Excel或你選擇的任何其他電子表格應用程序。
You’ll also notice two other icons in the bottom right-hand corner of the screen, the trash icon()and the stop icon ( ). These allow you to stop/continue/start the logging and also clear the logs, respectively.
你還會注意到屏幕右下角的另外兩個圖標,即垃圾箱圖標()和停止圖標。和停止圖標()。這兩個圖標分別允許你停止/繼續/啟動日志記錄,也可以清除日志。
Here’s what the exported log data looks like in Excel:
下面是導出的日志數據在Excel中的樣子:
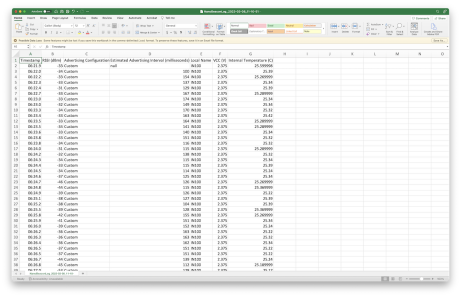
As you can see, this is a very powerful feature that allows you to take your data outside the app and perform any data analysis you wish!
正如你所看到的,這是一個非常強大的功能,允許你把你的數據帶到應用程序之外,并執行任何你想要的數據分析!
Now, this is great for continuous advertising data sets where you’ll always find the advertising set captured by the mobile app, but what about triggered advertising sets (if you’re unfamiliar with the concept of Triggered advertising sets in NanoBeacon, I encourage you to read our last tutorial on the topic, found here).
現在,這對連續的廣播數據集來說是很好的,你總能找到由移動應用程序捕獲的廣播集,但觸發的廣播集呢(如果你不熟悉NanoBeacon中觸發的廣播集的概念,我鼓勵你閱讀我們關于這個主題的最后一個教程,在這里找到)。
Let’s see how we can view logs for triggered advertising sets!
讓我們看看如何查看被觸發的廣播集的日志!
Monitor View 監控視圖
If you’ve used previous versions of the mobile app, you’ll notice that this is a new view that was just added recently.
如果你使用過以前版本的移動應用程序,你會注意到這是最近剛添加的一個新視圖。
The view allows you to see the last captured advertising data sets as well as the history/logs of the captured data. This can be very powerful, especially in the case of Triggered advertising sets, where the advertising sets are not always present. It is also a much more convenient way to view the logs for all configured advertising sets outside of the Scanner view.
該視圖允許你看到最后捕獲的廣播數據集,以及捕獲數據的歷史/日志。這可能是非常強大的,特別是在觸發式廣播集的情況下,廣播集并不總是存在。這也是一個更方便的方法,可以在掃描器視圖之外查看所有配置的廣播集的日志。
For our configuration example that we used in this tutorial, if we navigate to the Monitor view, we’ll notice the single advertising set that we configured:
對于我們在本教程中使用的配置例子,如果我們導航到監視器視圖,我們會注意到我們配置的單一廣播集:
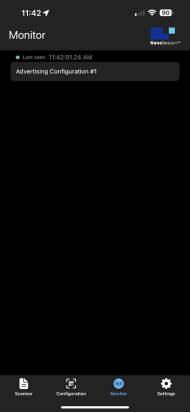
If we click on it, we’ll be taken to a view that’s identical to the one found when you click on “View Data” in the Scanner view. The data shown here is updated in real-time:
如果我們點擊它,我們將被帶到一個與你在掃描器視圖中點擊 "查看數據 "時發現的相同的視圖。這里顯示的數據是實時更新的:
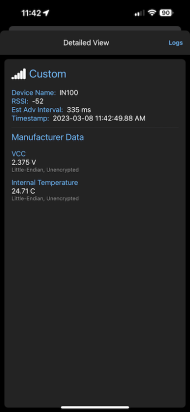
You’ll also notice you have the “Logs” button which will allow you to view the history of the data captured by the mobile app:
你還會注意到你有 "日志 "按鈕,這將使你能夠查看移動應用程序捕獲的數據的歷史:
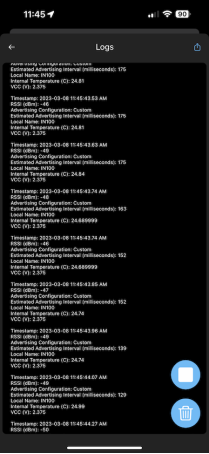
One cool experiment to run is to turn off your IN100 device (or simply take it out of range), verify that the device is no longer being discovered in the Scanner view, and then navigate to the Monitor view to see the log data for the advertising set.
一個很酷的實驗是關閉你的IN100設備(或者干脆把它帶出范圍),在掃描器視圖中驗證該設備不再被發現,然后導航到監視器視圖,查看廣播集的日志數據。
You’ll also be able to see the data included in the last-captured advertising set and see the timestamp it was captured at.
你還可以看到最后捕獲的廣播集所包含的數據,并看到它被捕獲的時間戳。
Summary 總結In this tutorial, we focused on the Logging feature of the app and showed how you can view the logs in two ways:
在本教程中,我們重點介紹了應用程序的日志功能,并展示了如何以兩種方式查看日志:
- From the Scanner view —> View Data —> Logs
- 從掃描器視圖->查看數據->日志
- From Monitor view —> click on Advertising Set of interest —> Logs
- 從監控視圖->點擊感興趣的廣播集->日志
Stay tuned for more tutorials covering new features that get added to the mobile app!
請繼續關注更多涵蓋移動應用程序新增功能的教程!
-
BLE
+關注
關注
12文章
660瀏覽量
59413 -
掃描器
+關注
關注
0文章
166瀏覽量
11913
發布評論請先 登錄
相關推薦
哪種二維碼掃描器適合生產線應用?
紅外、光感雙重觸發的條碼掃描器,用于生產線上
固定式掃描器哪款好?盤點高性價比型號推薦,打造高效掃碼體驗
工業固定式掃描器怎樣用?固定式工業條碼掃描器解決方案
如何設置條形碼掃描器模塊,掃碼器常見技術問題的解決
【北京迅為】iTOP-i.MX6開發板使用手冊第四部分固件編譯第十四章非設備樹Android4.4系統編譯
固定式工業條碼掃描器在mes系統中的各個環節應用
什么是固定式條碼掃描器?固定式掃描器怎么選?




 NanoBeacon? BLE掃描器教程(第四部分)


評論